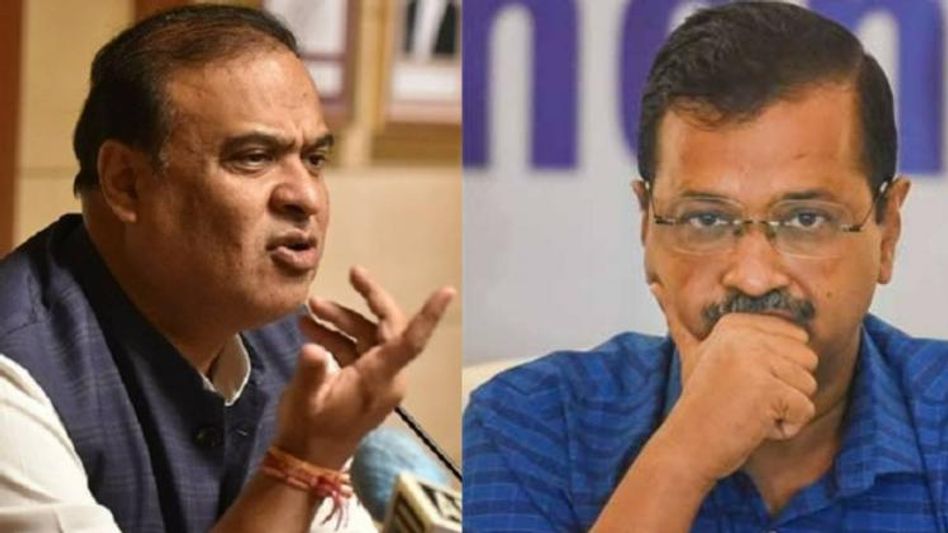
Kejriwal vs Himanta Biswa Sarma: Who runs better schools? The answer is here
Assam has 47,155 government schools compared to just 2,767 in Delhi, the northeastern state also has better pupil-teacher ratio than in the national capital.
 Assam CM vs Delhi CM
Recently, a social media war erupted between Delhi Chief Minister Arvind Kejriwal and Assam Chief Minister Himanta Biswa Sarma over the state of government schools in their respective states. The Twitter spat was triggered by Assam government’s decision to shut down 34 government schools where not a single student could pass the High School Leaving Certificate (HSLC) examination—10th board examination—conducted by the Secondary Education Board of Assam. Taking a dig at this decision, Kejriwal said that shutting down schools was not a solution and government should work towards improving the quality of education in schools.
Assam CM Sarma responded by saying that he—earlier as Assam education minister—opened four times more schools in Assam between 2013—the year Kejriwal became Delhi CM—and 2022 than Delhi currently has. While there is no end to these political debates, the state of learning in the country’s schools can be gauged from the results of the National Achievement Survey (NAS), a national level large-scale assessment conducted to obtain information about the learning achievement of students of classes 3, 5, 8 and 10 studying in state government schools, government aided schools, private unaided schools and Central government schools. The NAS 2021—second such exercise after the first one conducted in 2017—was released earlier this year in May.
The two surveys, however, doesn’t reflect any superlative performance by the students at the government-run schools in Delhi. In fact, barring all subjects in class 10 and language in class 8, government schools in Delhi score lesser than the national average. On the other hand, government schools in Assam score above the national average, and that of Delhi, in all subjects from class 3 to class 8. Assam’s government schools scores above Delhi in mathematics even in class 10. So, Delhi’s good performance, when it comes to learning outcome, is restricted to only class 10.
While Assam has 47,155 government schools compared to just 2,767 in Delhi, the northeastern state also has better pupil-teacher ratio than in the national capital. So, it can conclusively said that, though Assam doesn’t score well in learning outcomes of students of class 10, the numbers don’t support Kejriwal’s claim of running the ideal schools in the country.
The government school infrastructure
|
State |
Number of government schools |
Number of students |
Number of teachers |
|
Delhi |
2,767 |
24,09,441 |
81,807 |
|
Assam |
47,155 |
50,31,895 |
2,18,676 |
Source: UDISE+ 2019-20
Pupil teacher ratio—the number of students for every teacher
|
|
Primary (1-5) |
Upper primary (6-8) |
Secondary (9-10) |
Higher Secondary (11-12) |
|
India |
26.5 |
18.5 |
18.5 |
26.1 |
|
Delhi |
32.7 |
29.3 |
27.6 |
17.9 |
|
Assam |
21.6 |
13.6 |
11 |
16 |
Source: UDISE+ 2019-20
How the three states scored in the National Achievement Survey
Class 3
|
Subject |
National average 2021 |
Delhi’s Score 2021 |
Delhi’s score 2017 |
Assam’s score 2021 |
Assam’s score 2017 |
|
Language |
323 |
285 |
316 |
328 |
351 |
|
Mathematics |
305 |
269 |
299 |
318 |
338 |
|
Environmental Studies |
308 |
278 |
303 |
315 |
332 |
Class 5
|
Subject |
National average 2021 |
Delhi’s Score 2021 |
Delhi’s score 2017 |
Assam’s score 2021 |
Assam’s score 2017 |
|
Language |
302 |
284 |
303 |
306 |
323 |
|
Mathematics |
280 |
256 |
287 |
291 |
334 |
|
Environmental Studies |
279 |
257 |
292 |
291 |
328 |
Class 8
|
Subject |
National average 2021 |
Delhi’s Score 2021 |
Delhi’s score 2017 |
Assam’s score 2021 |
Assam’s score 2017 |
|
Language |
285 |
290 |
299 |
278 |
298 |
|
Mathematics |
248 |
235 |
244 |
251 |
283 |
|
Science |
240 |
235 |
248 |
237 |
289 |
|
Social Science |
247 |
235 |
258 |
254 |
294 |
Class 10
|
Subject |
National average 2021 |
Delhi’s Score 2021 |
Assam’s score 2021 |
|
MIL |
244 |
278 |
248 |
|
Mathematics |
210 |
211 |
218 |
|
Science |
195 |
206 |
194 |
|
Social Science |
220 |
229 |
217 |
|
English |
267 |
289 |
257 |
Copyright©2025 Living Media India Limited. For reprint rights: Syndications Today


